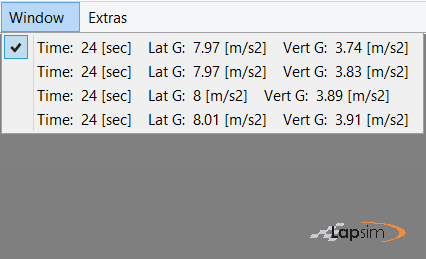
Root mean square of vertical and lateral acceleration

In order to distinguish the individual simulation runs, LapSim calculates the root mean square value of both the lateral and vertical acceleration.
These are used together with the duration of the simulation run, to make the 'name' of the simulation run. Apart from creating individual names, they supply possible objectives to optimize.
Analysing the dynamic model

Similar to the lap simulation, there is the possibility to 'watch' the vehicle in a 3D animation.
From our point of view, the animation is in the dynamic simulation more relevant than it is in the lap simulation. It gives you the opportunity to judge whether certain manoeuvres appear realistic to what you are trying to analyse.

With the buttons above the animation, one can select from which angle the vehicle is viewed.
Below the figures, one can select the speed of the animation. We advice 30% of reality, to get a proper impression of the manoeuvre.
Preselected combination of data traces

The plot menus are a preselection of data traces which from our point give a clear insight in the behaviour of the model.
The selection is similar to the lap simulation plots, apart from specific data traces, like the shockabsorber speeds.

There is one specific variable we would like to explain, which is the vertical movement of the tire contact patch.
The tire behaviour is strongly non-linear, because it can lose contact to the road. In regard to the dynamics, this is an important part to solve correctly, especially when one wants to analyse jumps.
Right mouse button click, horizontal or vertical zoom

Similar to the plot menus in the lap simulation, the zoom action is started by pressing the right mouse button. Subsequently moving the mouse creates the zoom area.
This zoom area is updated in all plots if the zoom is mainly focussed in horizontal direction, so in the time direction.

After releasing the right mouse button, the scale of the data plots are adjusted to the zoomed area.
In the plot where the input traces are shown, the zoomed area is highlighted.in addition the values of the data traces in the middle of the zoomed area, are displayed.

Vertical zoom
If the mouse movement is more in a vertical direction, LapSim shifts to vertical zoom, but only in the selected plot.
Subsequent double clicking in the vertically zoomed figure will reverse the vertical zoom. If a figure is zoomed both in vertical as in horizontal direction, a double click will always reverse the vertical zoom first.
Left mouse button click, reaction dependent on figure

If you engage the left mouse button in one of the data figures, the orange line will be updated to the position of the mouse and the values of the data traces at that point will appear. By scrolling through the plot, you can see the value continuously being updated.
By engaging the left mouse button in the input figure, you can move the zoomed area. The centre of the zoomed area will be where the mouse is.